2–30 Truck Shops: Two Changes That Raise First Time Fix Rate
Practical playbook for 2–30 truck plumbing, HVAC, and electrical shops. Measure FTFR, prioritize parts and diagnostics, and see how MEPflow supports the...

2–30 Truck Shops: Two Changes That Raise First Time Fix Rate

First time fix rate (FTFR) measures the share of service calls resolved completely on the first visit, with no return trip needed. The single most immediate action for any shop is to start measuring it with consistent inclusion rules and then attack the two biggest causes of repeat visits are missing parts and weak diagnostics.
TL;DR:
- Improving parts availability through better inventory management can significantly raise your first-time fix rate, especially on initial visits.
- Training technicians with diagnostic checklists and pairing skills with specific job types help reduce diagnostic errors and repeat visits.
- Consistent and disciplined tracking, including recording detailed close-out information and applying uniform exclusion rules, is crucial for accurate FTFR measurement.
- Target industry benchmarks vary, with top organizations reaching 86%, but internal goals should reflect your specific job complexity and work mix.
- Focusing on these key areas and using specialized software tools can lead to a measurable increase in first visit resolutions over time.
- ✓Trade calculators from the job
- ✓Photos and materials synced offline
- ✓Real-time job cost tracking
- ✓Scheduling and dispatch
Table of Contents
- What first time fix rate means and why it matters
- How to calculate FTFR correctly
- What a realistic FTFR target looks like
- Common causes of low first time fix rate
- A prioritized playbook for raising your fix rate
- How to measure and report FTFR without gaming it
- How practitioner-built software supports a higher fix rate
- The one change that actually moves the needle
- Try MEPflow to put this playbook into practice
- FAQ
- Sources
What first time fix rate means and why it matters
A first-time fix means a technician diagnosed the problem, completed the repair, tested the result, documented the work, and got customer approval, all in one visit. A temporary patch that avoids an immediate return trip does not count.
FTFR gets confused with two related numbers. First-call resolution usually applies to phone or remote support, while callback rate tracks jobs that come back after being marked complete, which is the inverse signal to FTFR. Low FTFR carries real operational weight:
- Every repeat visit burns a technician’s slot that could have gone to a new customer.
- Fuel, drive time, and dispatch overhead repeat without any new revenue attached.
- Customers who need a second visit for the same problem rate the experience lower, regardless of how the second visit goes.
Shops that treat FTFR as a core KPI, not a side stat, tend to catch capacity and cost problems earlier.
How to calculate FTFR correctly
The formula itself is simple. The hard part is deciding what counts, which is where most shops get inconsistent numbers.
- Count total completed jobs in your chosen time window, typically 30 days.
- Count jobs resolved on the first visit: diagnosed, repaired, tested, and approved by the customer with no scheduled return for the same issue.
- Divide and multiply by 100: FTFR = (first-visit resolutions ÷ total jobs) × 100.
- Apply exclusion rules consistently: diagnostics-only visits (where the job was scoping, not repair), no-access calls, canceled jobs, and warranty-covered callbacks tied to a part failure rather than technician error are commonly excluded, but the choice matters less than applying it the same way every month.
Say a shop closes 120 jobs in a month and 90 are resolved with no return visit for the same issue. The standard formula only produces a comparable number month to month when your inclusion rules stay fixed, so write them down once and reuse them.
What a realistic FTFR target looks like
Benchmark figures vary by trade and job complexity, so treat any published range as a reference point, not a scorecard to match exactly.
| Segment | First time fix rate |
|---|---|
| Top 20% of organizations | 86% |
| Median across 157 organizations | 75% |
| Bottom 20% of organizations | 53% |
A complex commercial electrical job carries different odds of a first-visit resolution than a residential drain clear, so a 2 to 30 truck shop does better setting an internal target by job type and tracking the trend than chasing one blended number against an industry figure from a different mix of work.
Common causes of low first time fix rate
Most repeat visits trace back to a handful of repeatable failure modes, and research into field-service completion backs this up directly.
- Parts not on hand: the single biggest driver, since a technician diagnosed correctly but can’t finish without the right part on the truck.
- Skill-to-job mismatch: dispatching a generalist to a job that needed someone certified on that specific system or brand.
- Thin pre-call information: the office books “no heat” without capturing equipment age, brand, or prior service history, so the technician arrives under-prepared.
- Access and scheduling gaps: no one home, gate codes missing, or a commercial job needing a facilities escort that wasn’t arranged.
- Documentation gaps: the prior visit’s notes are missing or vague, so the next technician starts from zero.
Research on field-service completion points to parts-on-hand, skill-to-equipment match, and demand anticipation as the three levers with the most influence over whether a job closes on the first trip.
A prioritized playbook for raising your fix rate
Start with the two fixes that cost the least and pay back the fastest, then layer in the rest.
- Tighten call intake: capture equipment brand, model, age, and the customer’s description of the symptom before dispatch, not after the technician arrives.
- Fix your parts strategy first: in one historical field-service study, best-in-class trucks had parts available 58% of the time on first visits versus 45% for everyone else. That gap is closed through better van stock rules, local pickup points, and consignment at high-volume customer sites, not by simply loading every truck with more inventory.
- Match skills to jobs on purpose: build a simple skill profile per technician (certifications, brands they know well, systems they’ve trained on) and route dispatch around it.
- Train to a diagnostic checklist: a structured approach like the Preliminary Diagnostic method used in HVAC separates quick fixes from problems that need deeper troubleshooting, which cuts guesswork on-site.
- Enforce close-out fields: require diagnosis, repair performed, parts used, test result, and customer approval on every job, with no exceptions for “quick ones.”
- Put mobile tools in technicians’ hands: offline-capable job records, photos, and live dashboards mean nothing gets lost between the truck and the office.
- Build a feedback loop: review callback reasons monthly and adjust training, parts stock, or dispatch rules based on what actually repeats.
A modeled optimization study at a large scale projected roughly a 9% improvement in first-visit completion from better technician assignment and part assortment alone, though that result came from a Fortune-100-scale operation and a small shop should weigh inventory cost against revisit savings before copying it directly.
Pro Tip: Pilot one checklist and one parts change at a time so you can tell which fix actually moved your number.

How to measure and report FTFR without gaming it
Reliable FTFR tracking depends on a few disciplined habits rather than a complicated system.
- Require consistent close-out fields: diagnosis, repair performed, parts used, test result, customer approval, and a reason code for any return visit.
- Pick a reporting window and stick to it: 30 days is standard, segmented by job type and by technician so you can see where the number is actually moving.
- Pair FTFR with companion metrics: callback rate, CSAT, and rework logs keep technicians from closing jobs early just to protect their score.
- Audit a sample of closed jobs monthly: spot-check that “first-time fix” tags match what actually happened in the field notes.
A field-service KPI tied to quality, not isolation: IBM’s coverage of FTFR recommends pairing the metric with customer satisfaction and rework tracking so the number reflects real problem-solving instead of a technician rushing to mark a job closed.
How practitioner-built software supports a higher fix rate
Raising FTFR is mostly a discipline problem, and the tools a shop uses either make that discipline easy or get in the way of it. We built our platform as a mobile and desktop solution for plumbing, HVAC, and electrical shops, designed and tested by experienced tradespeople running it on their own trucks before releasing it more widely.
- Intake capture: scheduling and dispatch tools that carry equipment and job history into the technician’s hands before the truck leaves the yard.
- Parts and job costing: job costing for labor, materials, and overhead that makes parts-on-hand gaps visible instead of hidden in a spreadsheet.
- Checklists and photos baked into the job: close-out fields and photo documentation attached directly to each job record.
- Offline-first mobile app: job status, photos, and materials sync automatically once signal returns, so nothing gets lost on a job site with no coverage.
- KPI dashboards: reporting tools built to track patterns like repeat visits by technician or job type over time.
The one change that actually moves the needle
If a shop can only fix one thing this quarter, fix parts availability and run one diagnostic checklist on the trade that generates the most callbacks. Those two changes touch more jobs than any scheduling tweak or software rollout ever will.
The warning that matters just as much: never chase FTFR as an isolated number. A technician under pressure to hit a target will find ways to mark jobs “fixed” that aren’t, and that shows up later as callbacks, warranty disputes, or a customer who doesn’t call back at all. Measure the fix rate, but measure callback rate and customer approval right alongside it.
— Jonathan
Try MEPflow to put this playbook into practice
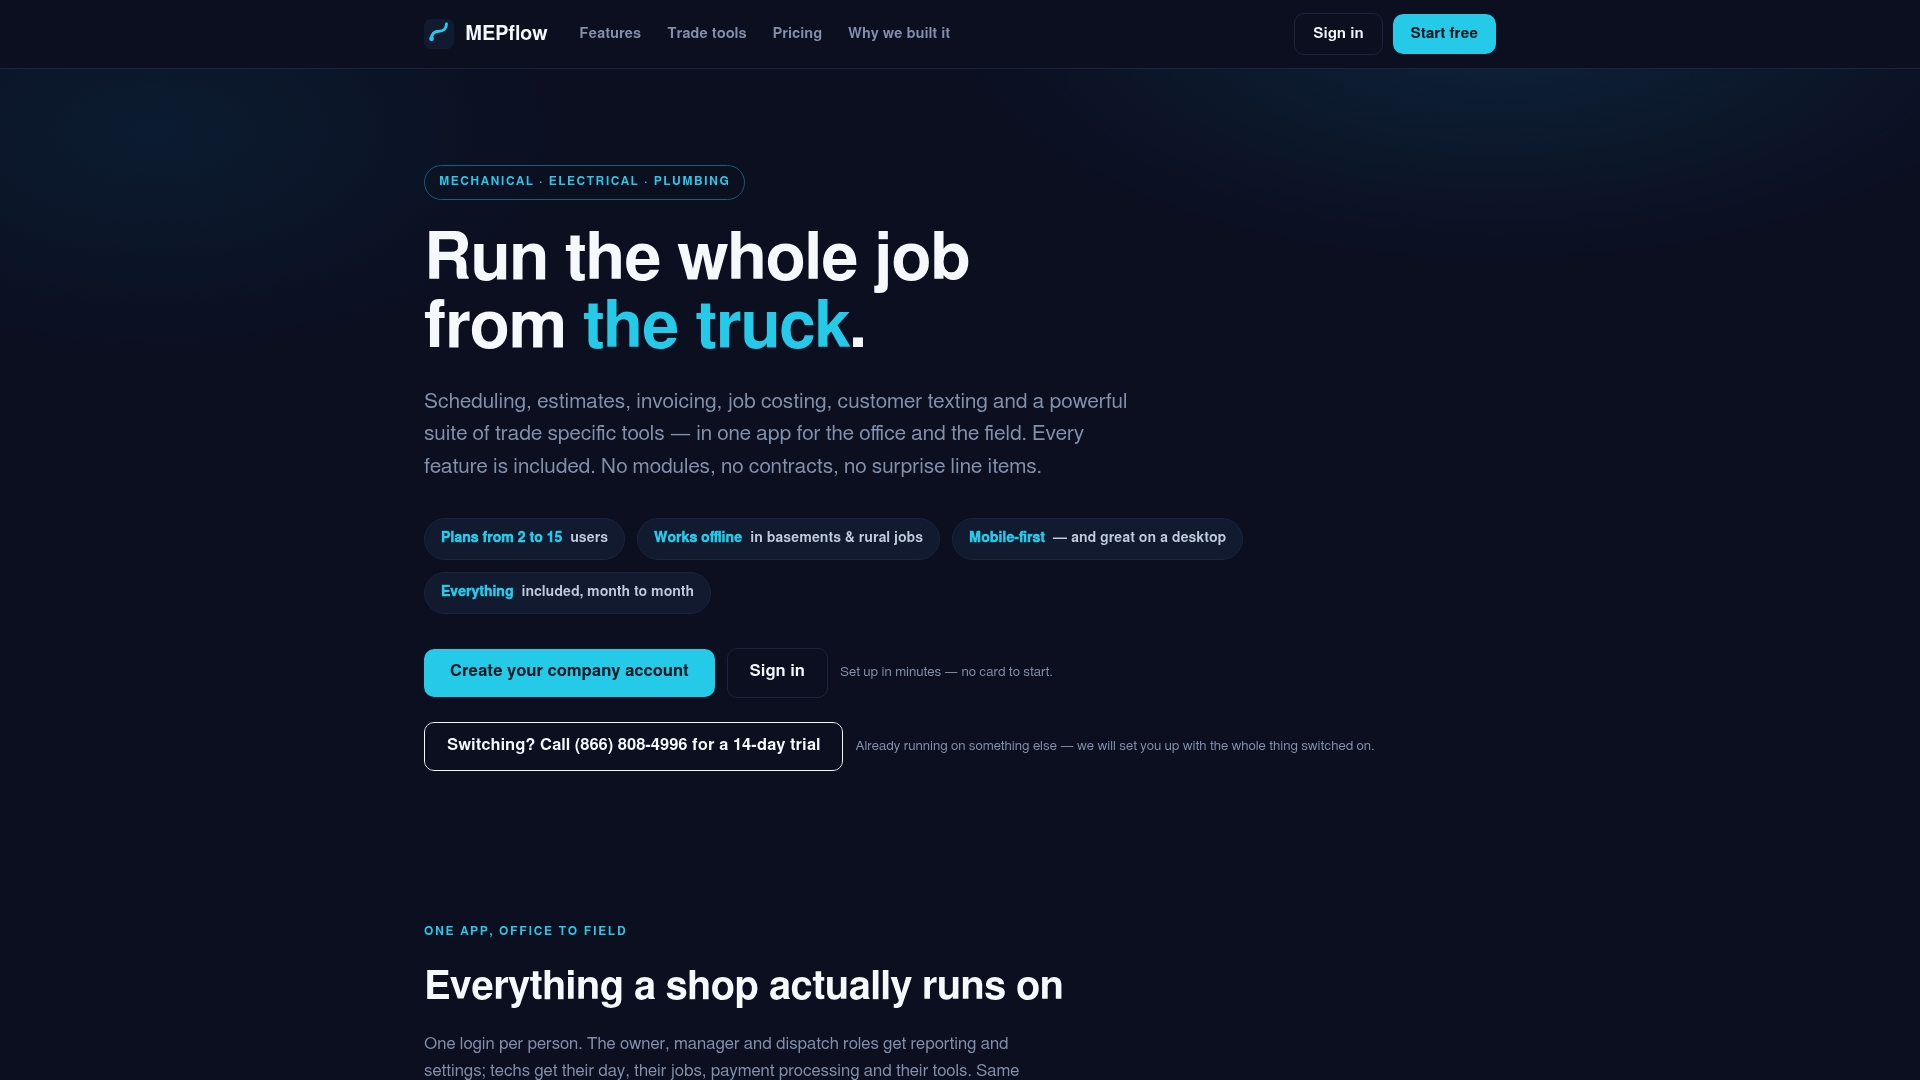
Everything in this playbook, tighter intake, parts visibility, checklists, and dashboards, lives easier inside one system than spread across a notebook, a group text, and a spreadsheet. We built MEPflow mobile-first for the technician standing in front of the job, with a full desktop side for the office running the same data, and it works offline so a dead zone in a basement or a rural service call never costs you a photo or a job note.
- Scheduling and dispatch carry equipment history and job notes to the technician before they arrive.
- Job costing and a per-trade pricebook make parts and labor patterns visible instead of buried.
- Trade calculators sit one swipe from the job itself, not in a separate app.
| Tactic from this playbook | How MEPflow supports it |
|---|---|
| Tighter call intake | Scheduling and dispatch with job history attached |
| Parts visibility | Job costing for labor, materials, and overhead |
| Diagnostic checklists | Photo and close-out fields attached to each job |
| KPI tracking | Reporting tools built into the same platform |
Every feature above is included on every plan, since plans differ only by how many people are on them. Create your company account to get started, check current plans at Mepflow, or call 866-808-4996 to book a 14-day trial.
FAQ
How do you calculate first time fix rate?
Divide the number of jobs resolved on the first visit by total completed jobs, then multiply by 100. Define your inclusion rules once (what counts as diagnostics-only, no-access, or warranty callbacks) and apply them the same way every reporting period.
What is the first fix rate?
First-time fix rate (also called first fix rate) is the percentage of service jobs completed, tested, and approved by the customer in a single visit, with no return trip for the same issue. It differs from first-call resolution, which typically applies to phone or remote troubleshooting rather than an on-site repair.
What is the industry standard for first time fix rate?
One analysis of 157 service organizations found a median of 75%, with top-performing organizations reaching 86% and lower performers around 53%. Benchmarks vary by trade and job complexity, so treat these as reference points rather than a fixed target.
What is the right first time fix rate for my shop?
The right target depends on your job mix. A shop doing mostly straightforward residential repairs should expect a higher number than one handling complex commercial systems, so set an internal target by job type and track the trend rather than copying one industry figure.
Sources
- Analysis of First-Time Completion in the Field Service Environment — SMU/Datascience review
- Heating, Air Conditioning, and Refrigeration Mechanics and Installers — BLS
- Improving first-visit service completion using optimization and simulation — SAS proceedings
- What is first-time fix rate (FTFR)? — IBM Think
Where to next
- See what MEPflow doesScheduling, estimates, dispatch, invoicing and job costing in one app.
- Create your company accountSet your shop up in a few minutes. No card to start.
- How to Reduce Field Service Scheduling TimeMore from the MEPflow blog
- Cut No Shows 25%: Text Appointment Reminders for Service ShopsMore from the MEPflow blog